Change Over Time
The graph below shows the annual average for lead in community air, as well as lead in children’s blood from 1992 to 2024. The graph indicates:
- Since 2018, Pb in airborne dust has been lower than the U.S. EPA standard of 0.15 micrograms per cubic metre µg/m3. Canada doesn’t have an applicable standard.
- Teck’s Fugitive Dust Reduction Program (a program focused on reducing emissions from fugitive or non-stack sources) has delivered an 80% reduction in Pb in airborne dust in the community since 2012.
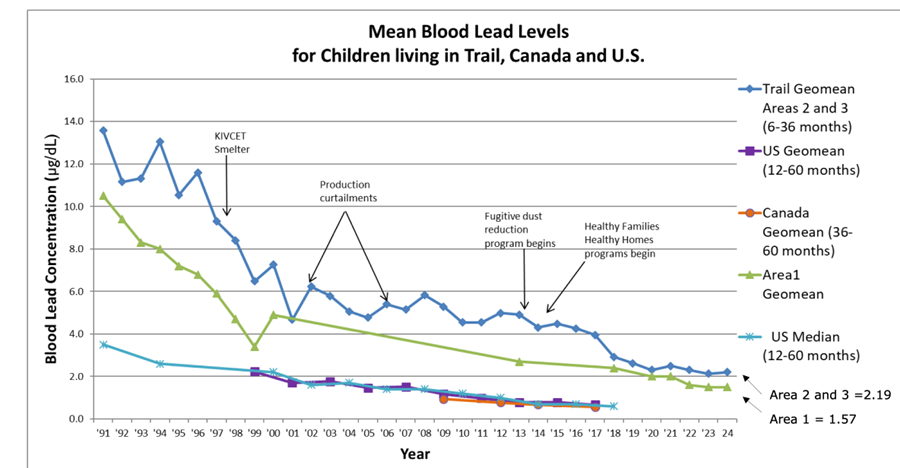
The graph below provides further detail on the one above. It shows mean blood lead levels for children living in Trail compared to those in Canada and the USA. The graph indicates:
- All groups (Trail Areas 2 & 3, Area 1, Canada, and the U.S.) show a strong downward trend in children’s blood lead concentrations from 1991 to 2024.
- Children in Trail (Areas 2 & 3) began the period with much higher lead levels than the U.S. or Canada, but levels dropped sharply following major industrial change (such as the KIVCET smelter introduction and dust-reduction programs) approaching North American averages by the 2020s.
- By 2020–2024, blood lead levels across all groups fall below ~3 µg/dL, indicating substantial long-term improvement and narrowing of regional differences.
- It’s important to note that children in Trail are tested at the age when blood leads typically peak. Children across Canada and the U.S. are tested for a different age range including older children, where blood lead levels typically trend down. Therefore, it’s not a direct comparison.